
| Introduction | Task | Process | Evaluation | Conclusion |
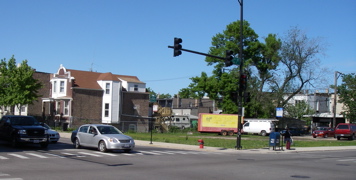
Does your neighborhood need a teen center?
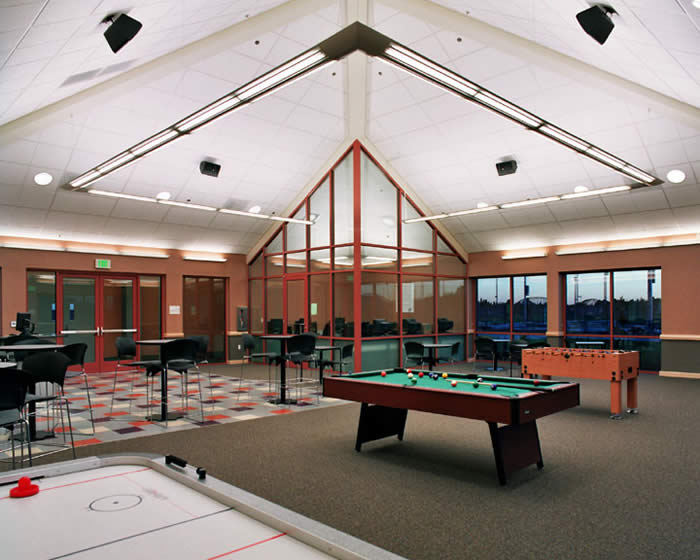
What will your teen center look like?
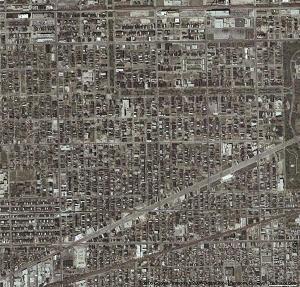
Your neighborhood from space
The Process
You must persuade Mayor Daly. To prepare for your meeting with Mayor Daley, you will need to make a strong case using two formats.You must create a written report, and prepare a presentation which will be delivered verbally. See the project Evaluation page for details on how you will be graded on the report and presentation.
The Steps to Making Your Presentation
1. Choose roles.2. Make a plan.
Checkpoint #1: As a group, complete the Brainstorming worksheet and turn in to the teacher.
3. Work on your own to complete the requirements of your role.
Checkpoint #2: Complete the Checkpoint #2 checklist.
4. Come back together and assemble your presentation.
5. Practice your presentation.
Making Your Presentation
1. Choose roles: Your group must assign each member to a role. Each person will be held responsible for the tasks described in the role as well as the overall product.
Cartographer: You are your team's mapmaker. Your job will be to plot resources in your neighborhood on your neighborhood map. See Cartographer job details
Resource finder: You find the resources in your neighborhood. You will provide the cartographer with the addresses of neighborhood resources. See the Process page for the kind of resources you need to find, and some places where you can look. See Resource Finder job details
Data miner: You job is to mine the Internet for data about your neighborhood. The data you find will help convince the Mayor about the need for a teen center in your neighborhood. See the Process page for the kind of data that will support your position, and some places where you can look. See Data Miner job details
If your group has more than three members, two people should be data miners.
Back to top
2. Make a plan: As a group, discuss the following to topics. Take detailed notes to help you guide your
Plan the teen center you want to build. Look at general encyclopedia entries about teen centers.
Also look at teen center websites in Chicago (like Boys and Girls Club and Chicago Youth Centers. Make a list of the services and facilities you would like your teen center to provide. Think about sports, homework help, health services, classes, arts and crafts, theatre, dance, etc.
Plan your case to the mayor. Chicago's mayor is very busy and many neighborhoods in the city believe they deserve a teen center. How can your group convince the Mayor - in a short amount of time and using strong evidence - that your neighborhood deserves the teen center?
- What information you will use to help convince him?
- What are positive things about your neighborhood?
- What are negative things about your neighborhood?
- Why does your neighborhood need a teen center?
- Where will you find evidence to help you make your case?
Checkpoint #1: As a group, complete the Brainstorming worksheet and turn in to the teacher.
Back to top
3. Work individually to complete the requirements of your role:
Cartographer:
Create a map. You will work with your group to create a map of the two-square mile area around your school.
I need some practice reading a map.
I want to review map basics
I want to review map terms.
You will use your map to show what organizations already exist in your neighborhood, so it should be large enough to include labels. Your map should also include a color coded legend to represent the different types of organizations, parks and other resources or problem areas you find. Use the sample map to get started.
Organize your information and mark it on your map. You will need to work with your group's Resource Finder to identify and plot existing resources on your map.
Resource Finder:
Locate resources. With your group members, choose six (6) items from the list below that you think will help you convince the Mayor that your neighborhood needs a teen center. Locate what already exists in your neighborhood.
You can use Google Maps to locate some resources that exist (or, just as importantly, do NOT exist) in your neighborhood.
To use Google maps to find resources in your neighborhood, go to the Google maps website and type in [what you are looking for] NEAR [address]. For example, to find parks near Dvorak Academy, which is located at 3615 W. 16th St, Chicago IL, search for:
| Positive | Negative | |
| Other teen organizations | Liquor stores | |
| Parks | Drug corners | |
| Playgrounds | Empty lots | |
| Libraries | High crime areas | |
| Sports programs | Abandoned buildings | |
| Movie theaters | ||
| Other (be explicit) | Other (be explicit) |
You can also find resources in your neighborhood by talking with each other in your groups, or asking adults who are familiar with your neighborhood.
Data Miner:
Find, organize and present statistical data to support your case. Look at the choices below, and refer to your brainstorming worksheet. Decide what pieces of data will most help you convince the mayor that your team needs a teen center.
- Number of children under 18 in the neighborhood
- Percentage of children under 18 in the neighborhood
- Average people in a household
- Crime rates (choose the type of crime you believe matters most)
- Average family income
- Average home price
- Percentage of renters vs. Percentage of home owners
- Unemployment rate
- Education Levels
Here are some places to look for data:
- Chicago Fact Finder
- Chicago Prospector: Click on "Neighborhood Analysis", enter your neighborhood and run a demographics report.
- Realtor.com: Realtors also need to have accurate information about neighborhoods. Click on "Housing Data and Maps" and scroll through the menu bar to find the information you want. This site includes comparisons to other neighborhoods and the City of Chicago as a whole.
Compare your data. Once you have chosen four pieces of information, you will want to compare the data from your neighborhood to data from the city of Chicago as a whole. Back to top
Make a table and graph. Present your data in a form that will make its meaning clear to Mayor Daley. Each piece of data you present should be in the form of both a table and a graph (bar, line, circle, etc.).
Make sure that your statistical analysis includes:
- the exact area that your data covers (the ward, the block, the neighborhood, etc).
- the exact time period that your data covers (week, year, decade, etc.)
- a title for each chart and graph
- all axes labeled
See a sample table and graph, and how to read the data.
4. Come back together and assemble your presentation.
Your presentation will be in two parts. The first part will be a written report where you will use your persuasive writing skills to make your case for the teen center. See the Evaluation page for details on how you will be assessed for your presentation. Make sure you include a table of data and a copy of your map in the report.
The second part will be a verbal presentation. The presentation should not be more than 10 minutes. The presentation should include some visual aids to help make your case. You are preparing the presentation for the mayor, but you will give the presentation to the class first.
5. Practice your presentation.
Be sure to practice your presentation before giving it. Remember -- 10 minutes max!
Back to top
| Introduction | Task | Process | Evaluation | Conclusion |